ESG & Carbon Accounting Platform
Greenview Portal is a B2B SaaS platform designed for ESG sustainability reporting and analytics.
The problem: The platform had performance issues, with features taking months to build and often rolled back due to errors and poor usability. It was difficult to use and didn’t meet business needs.
The solve: We rebuilt Greenview Portal with a focus on user-friendly design and performance, aiming to create a scalable platform for sustainability tasks.
My role: I was the sole product designer in a remote team with a product manager and engineers.
Research
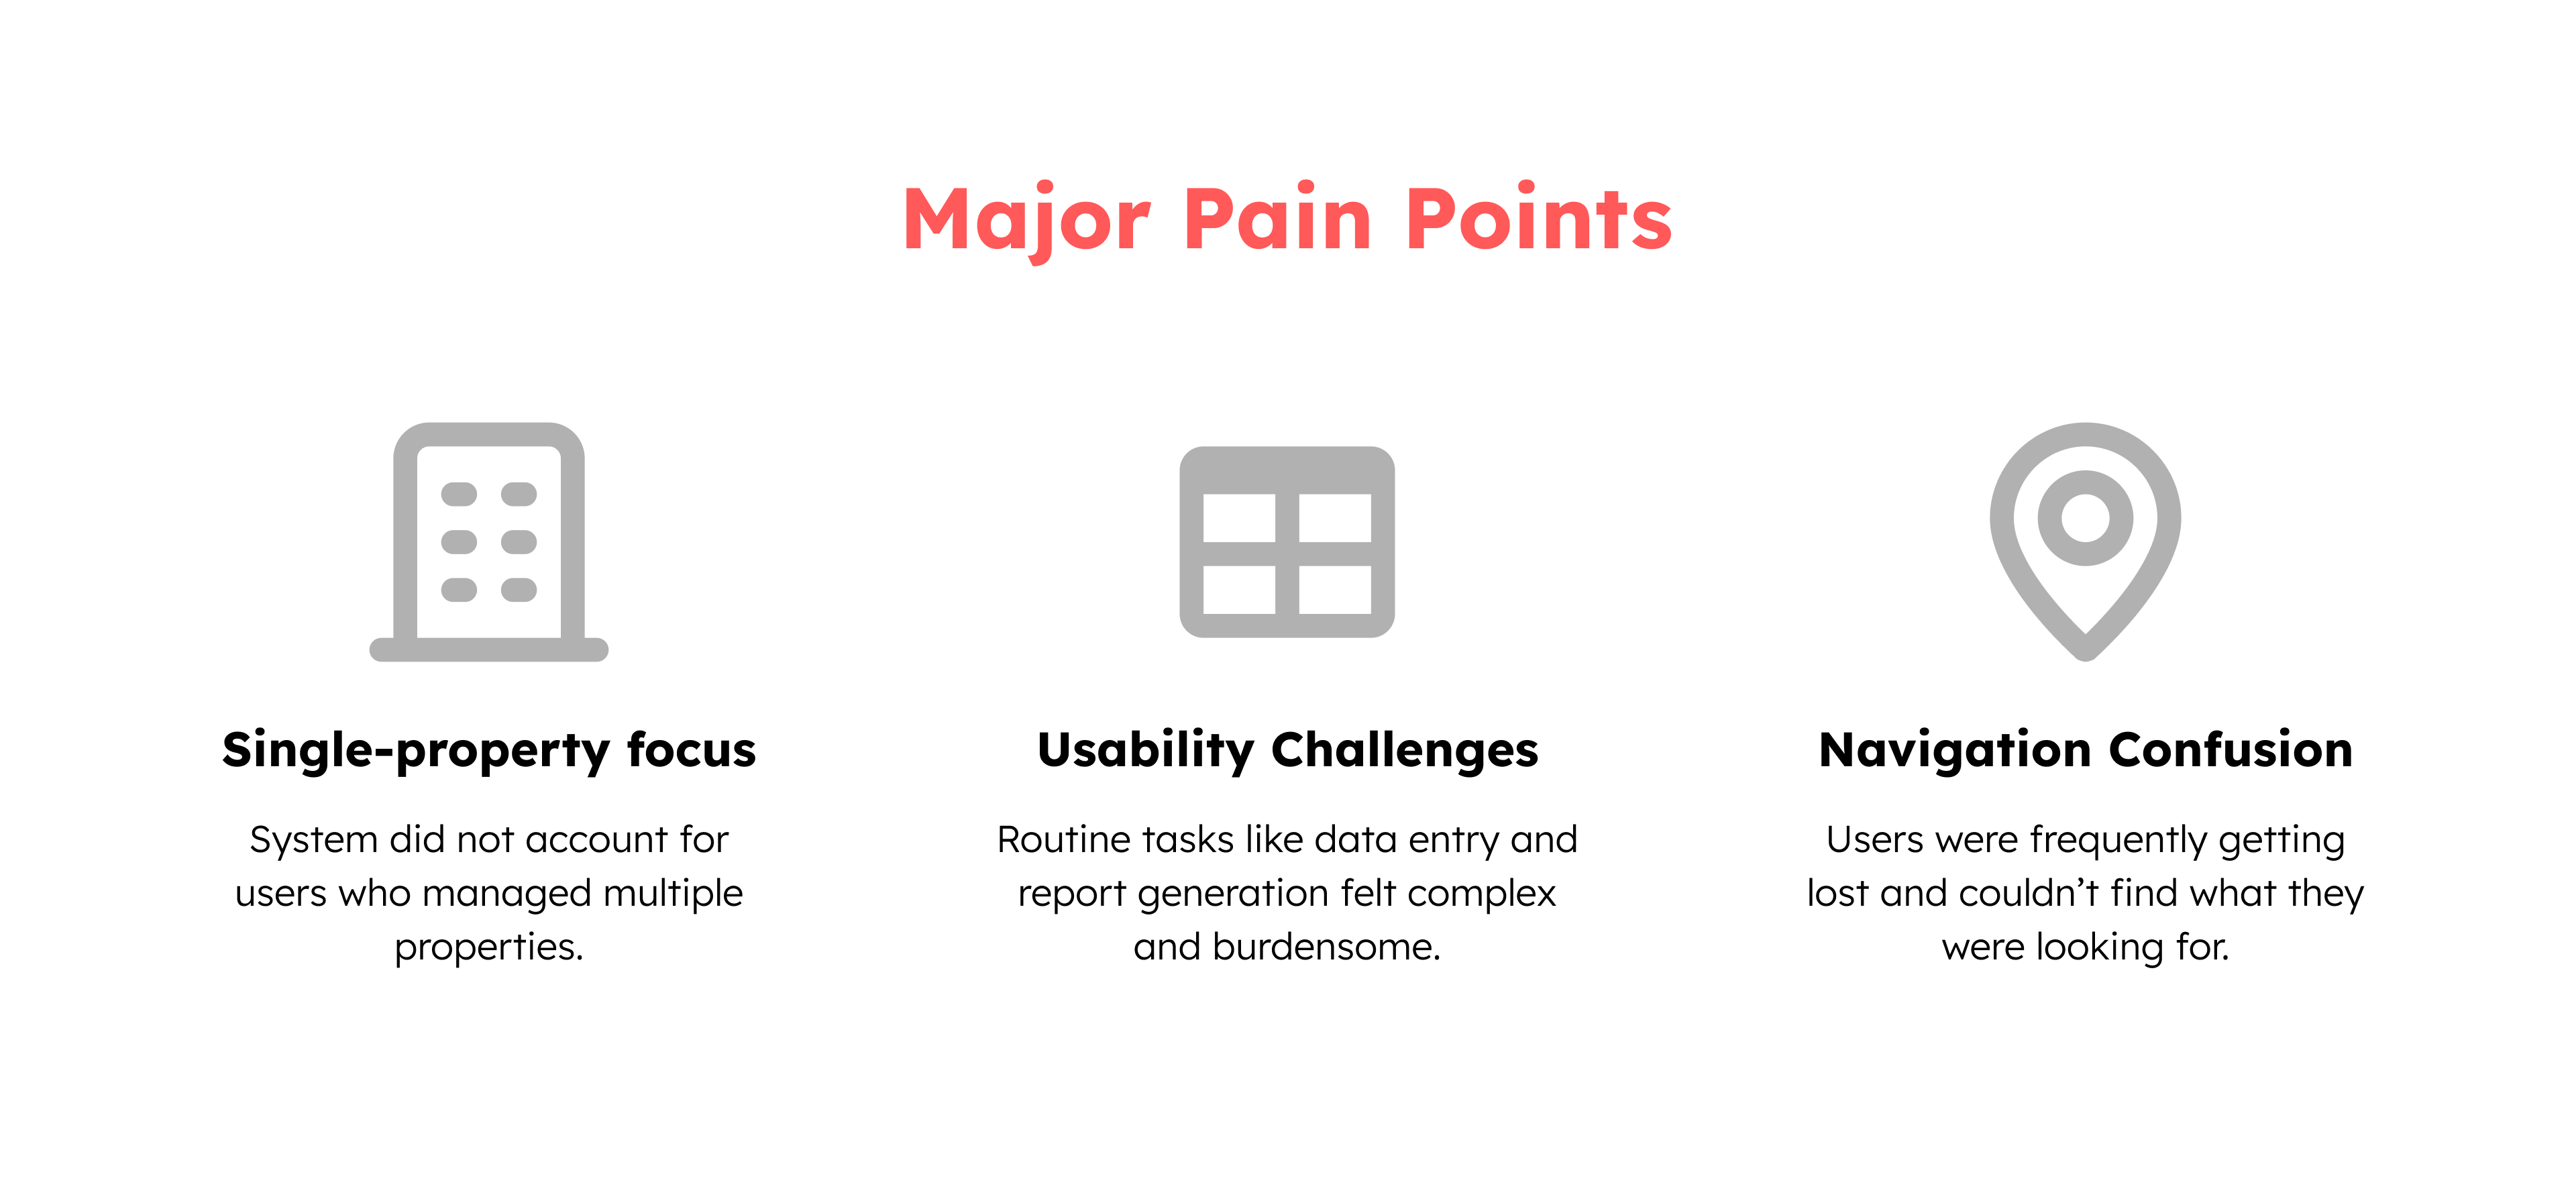
The scope was pretty ambiguous at first, so we ran over 30 user interviews and focus groups to really understand why the platform wasn’t working for them. We found these key problem areas:
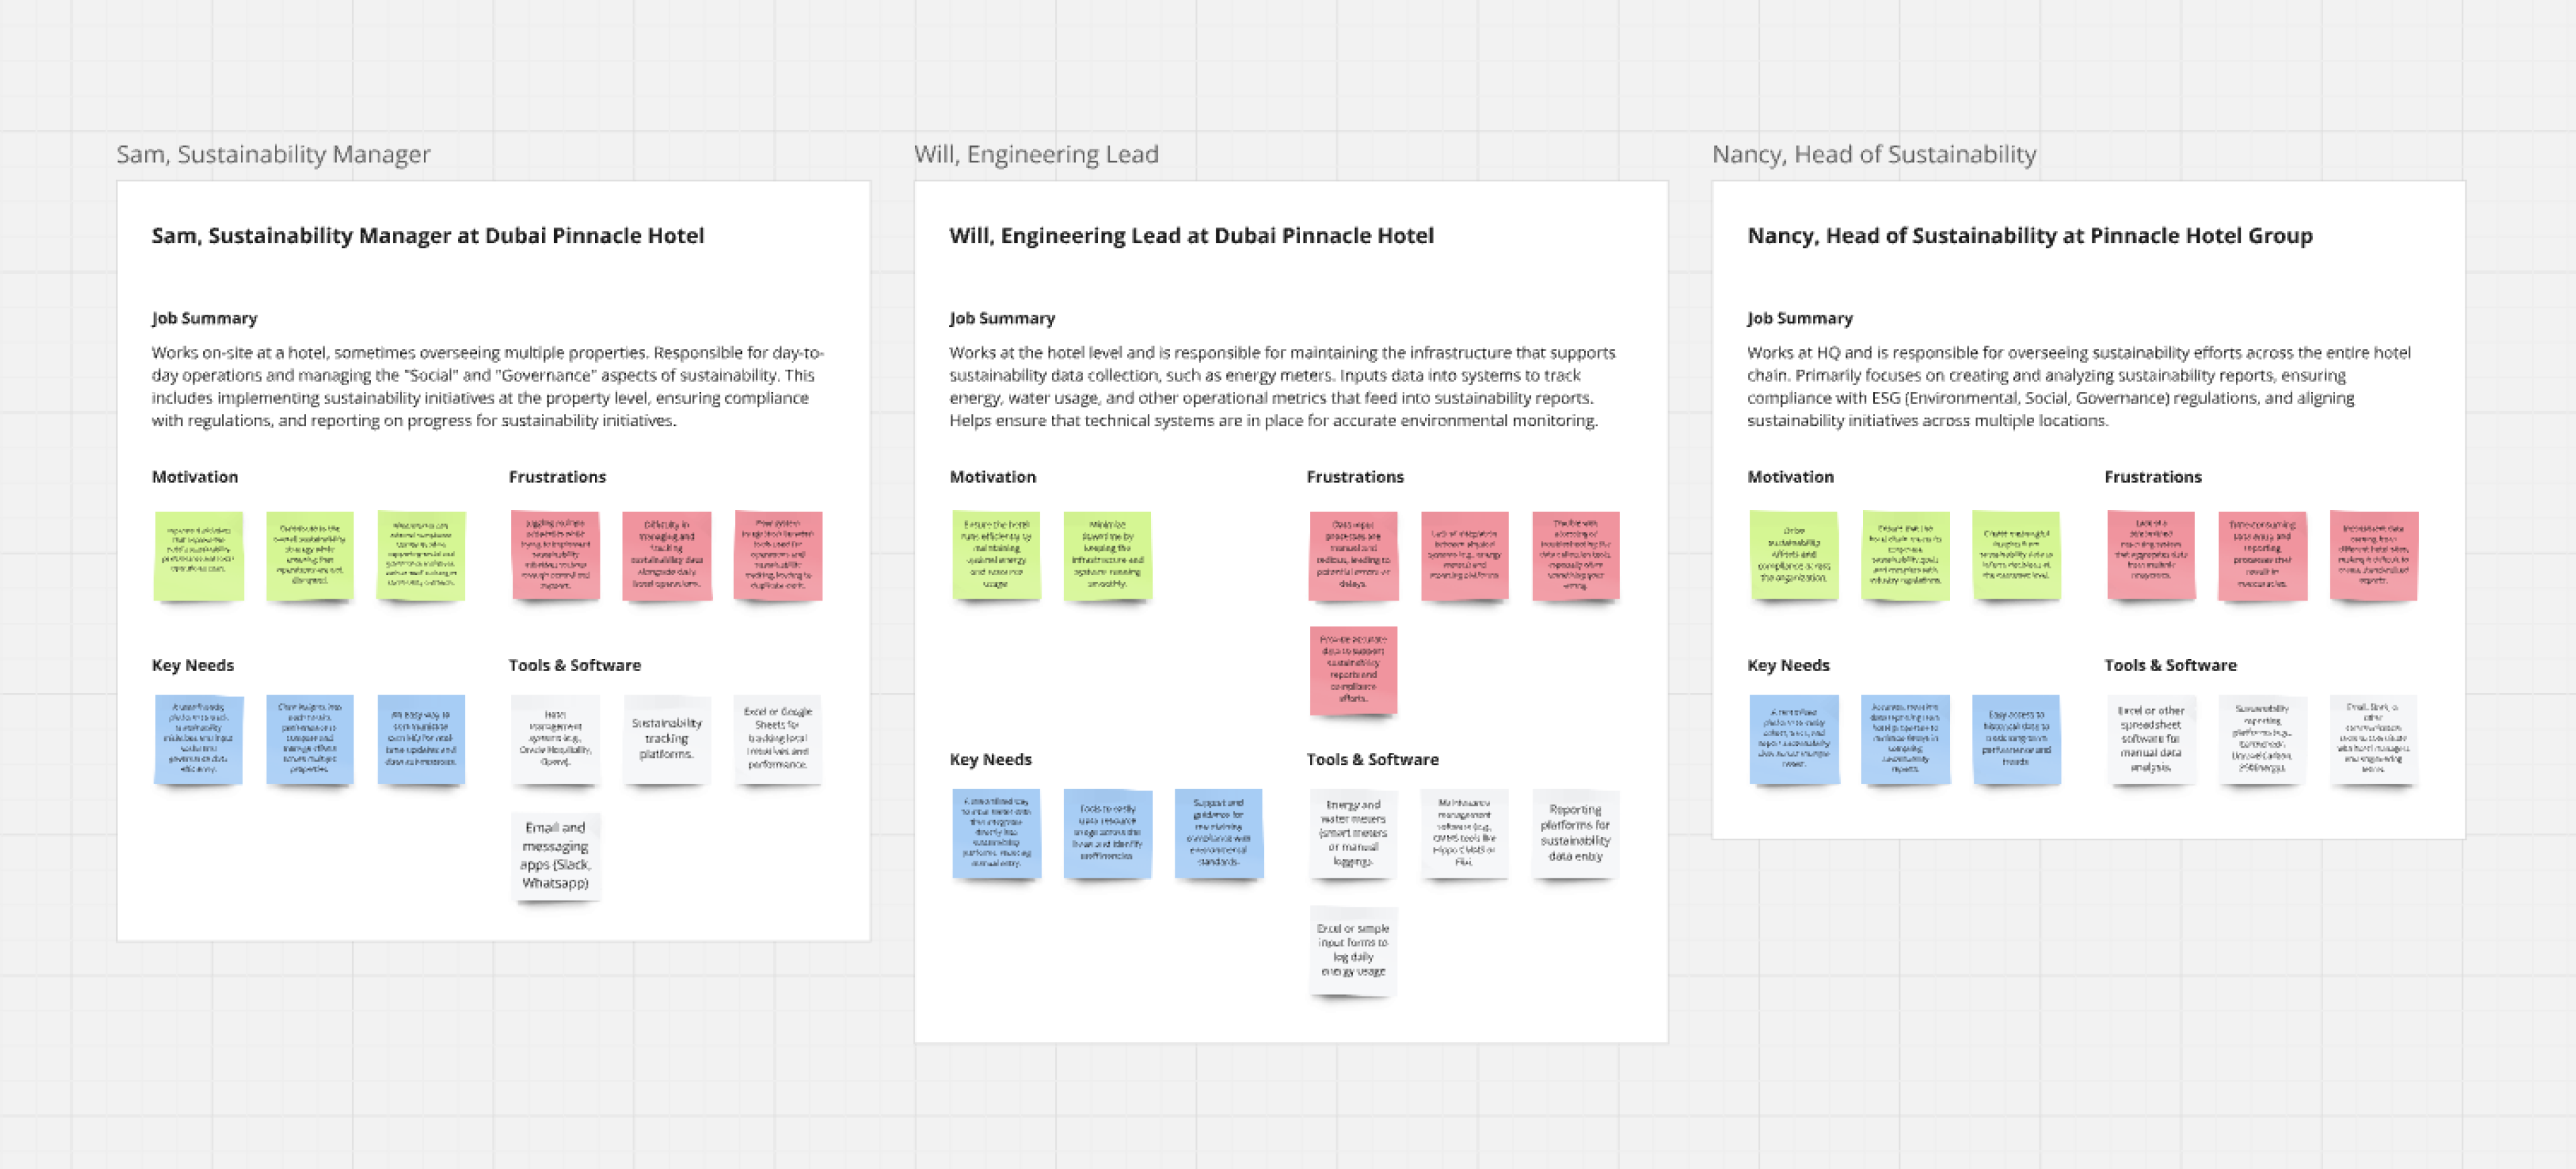
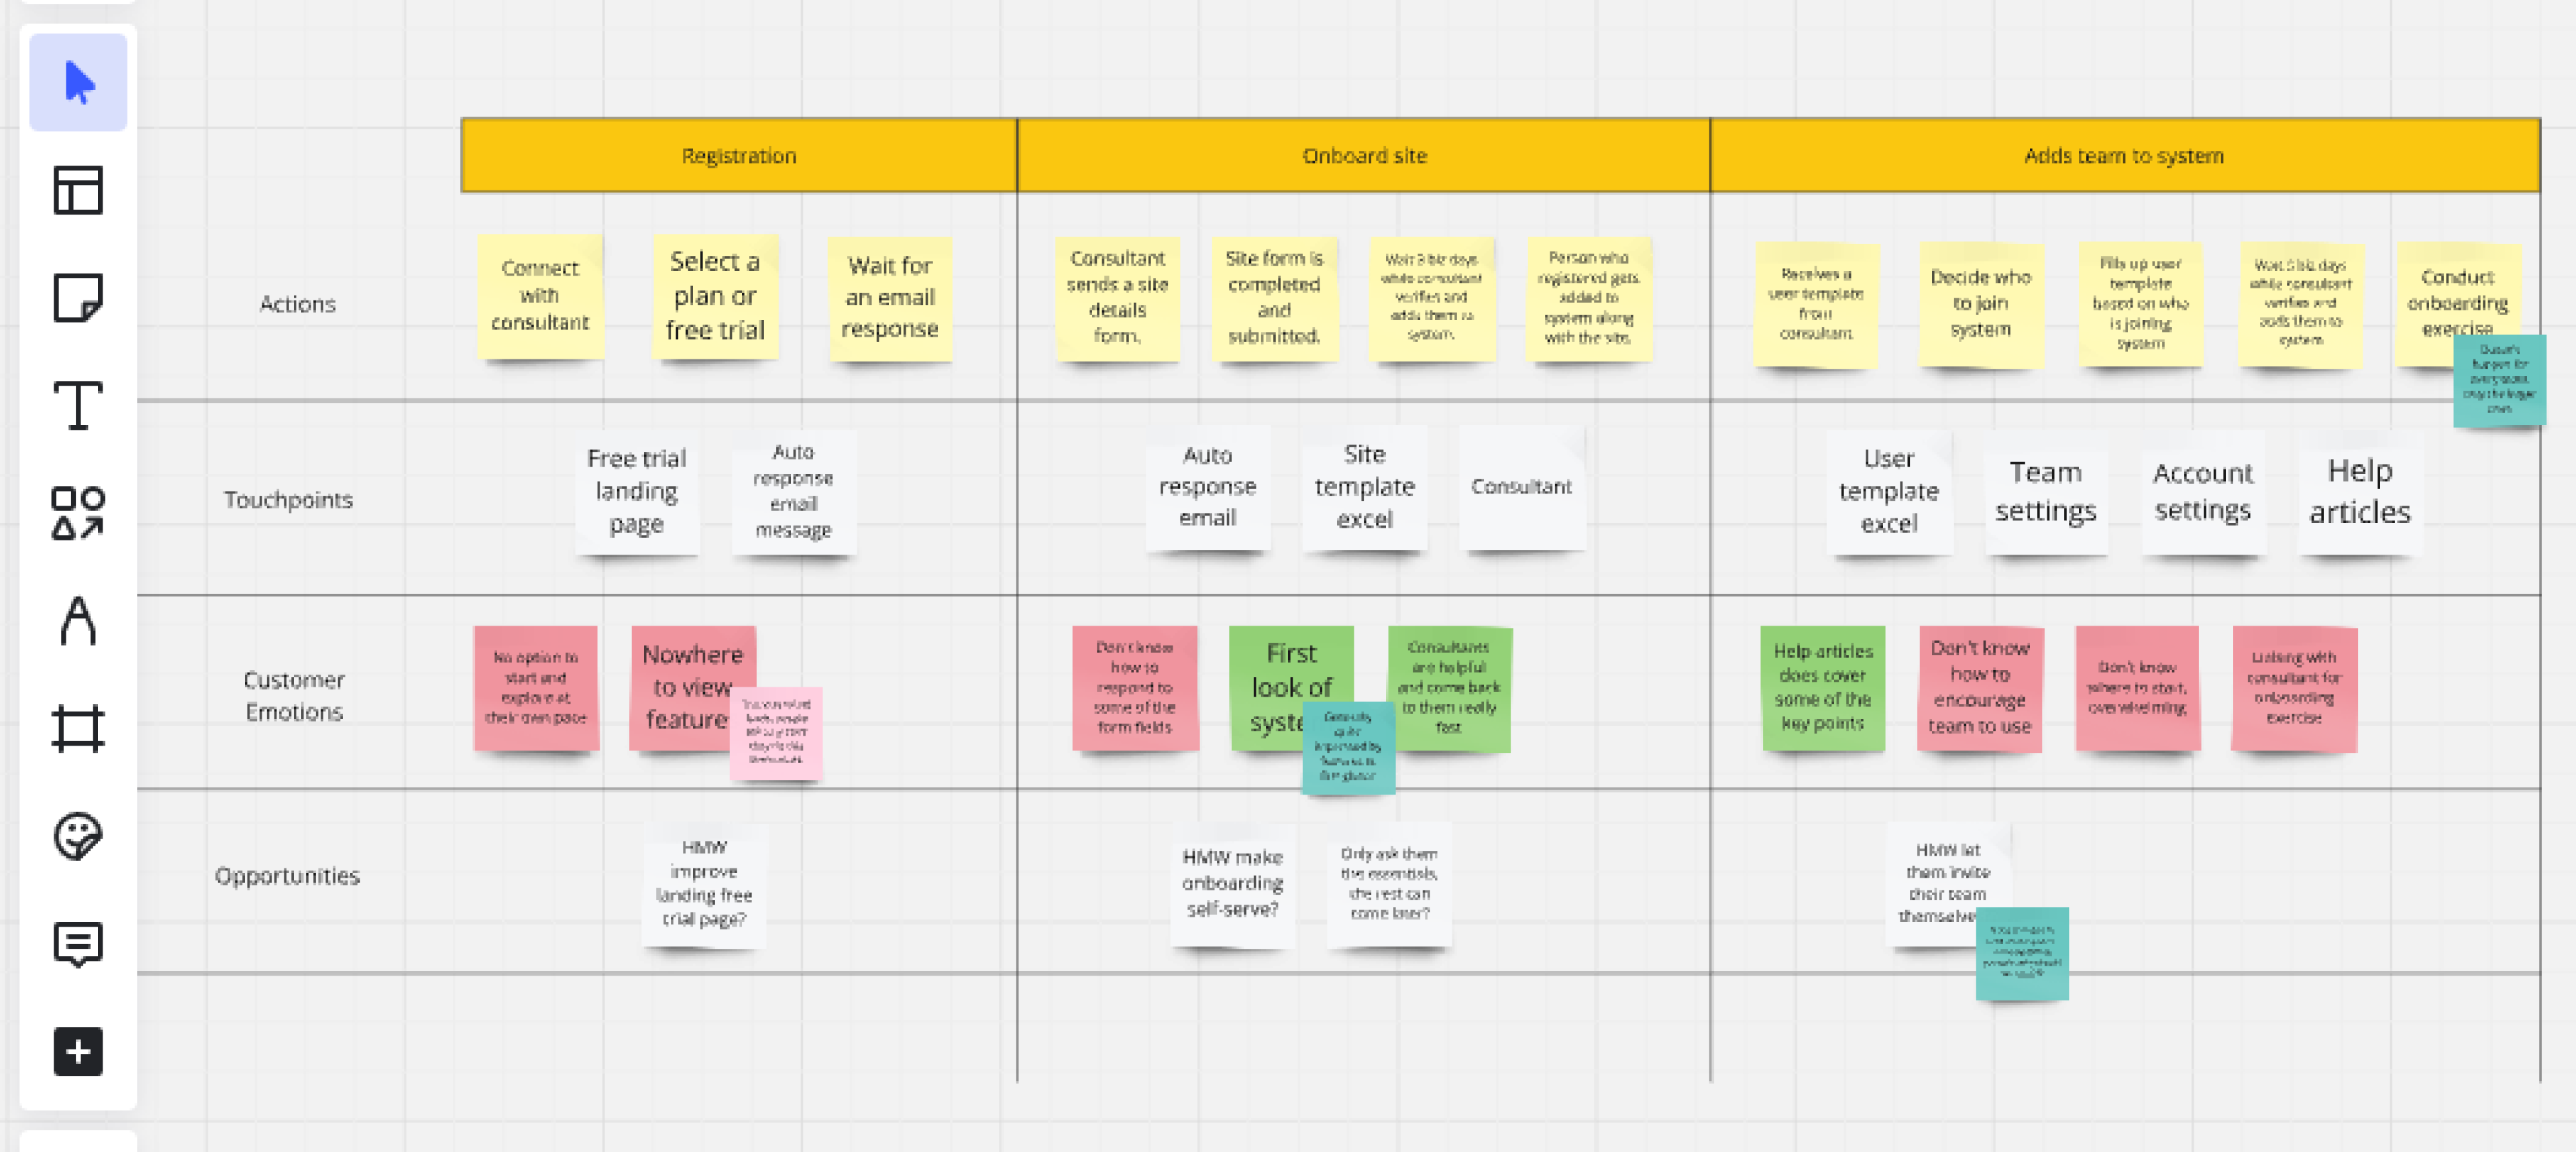
To outline features clearly, we created personas and mapped several user journeys for major tasks to understand the needs our product had to meet.
Design
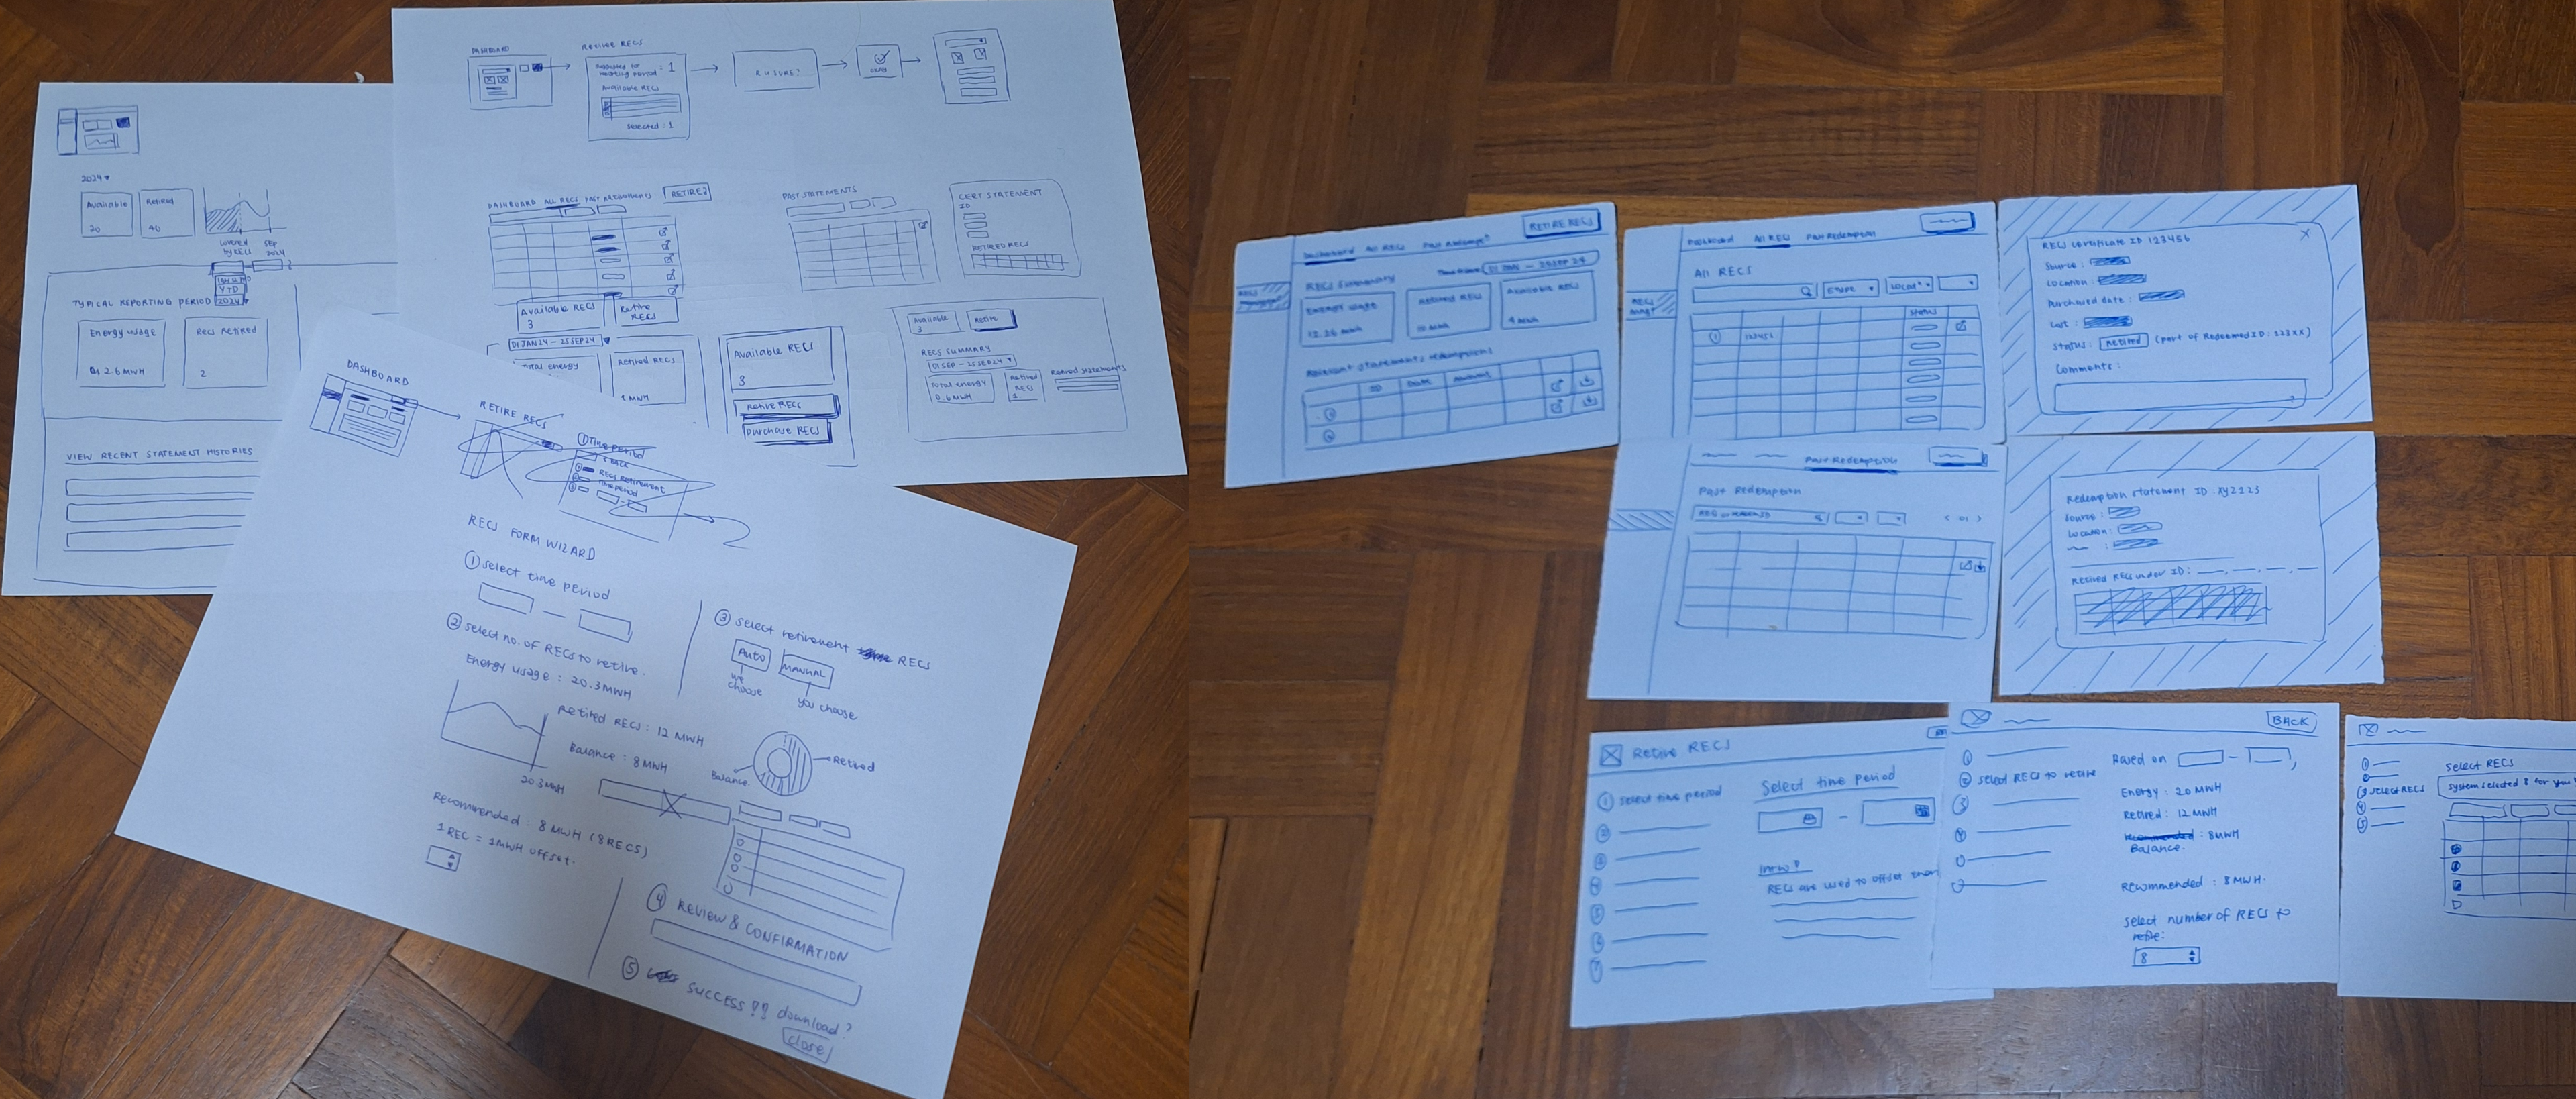
Every feature I design starts with a lot of paper sketching. During this phase, I also work on defining the information architecture and controlled vocabulary to keep the platform consistent.
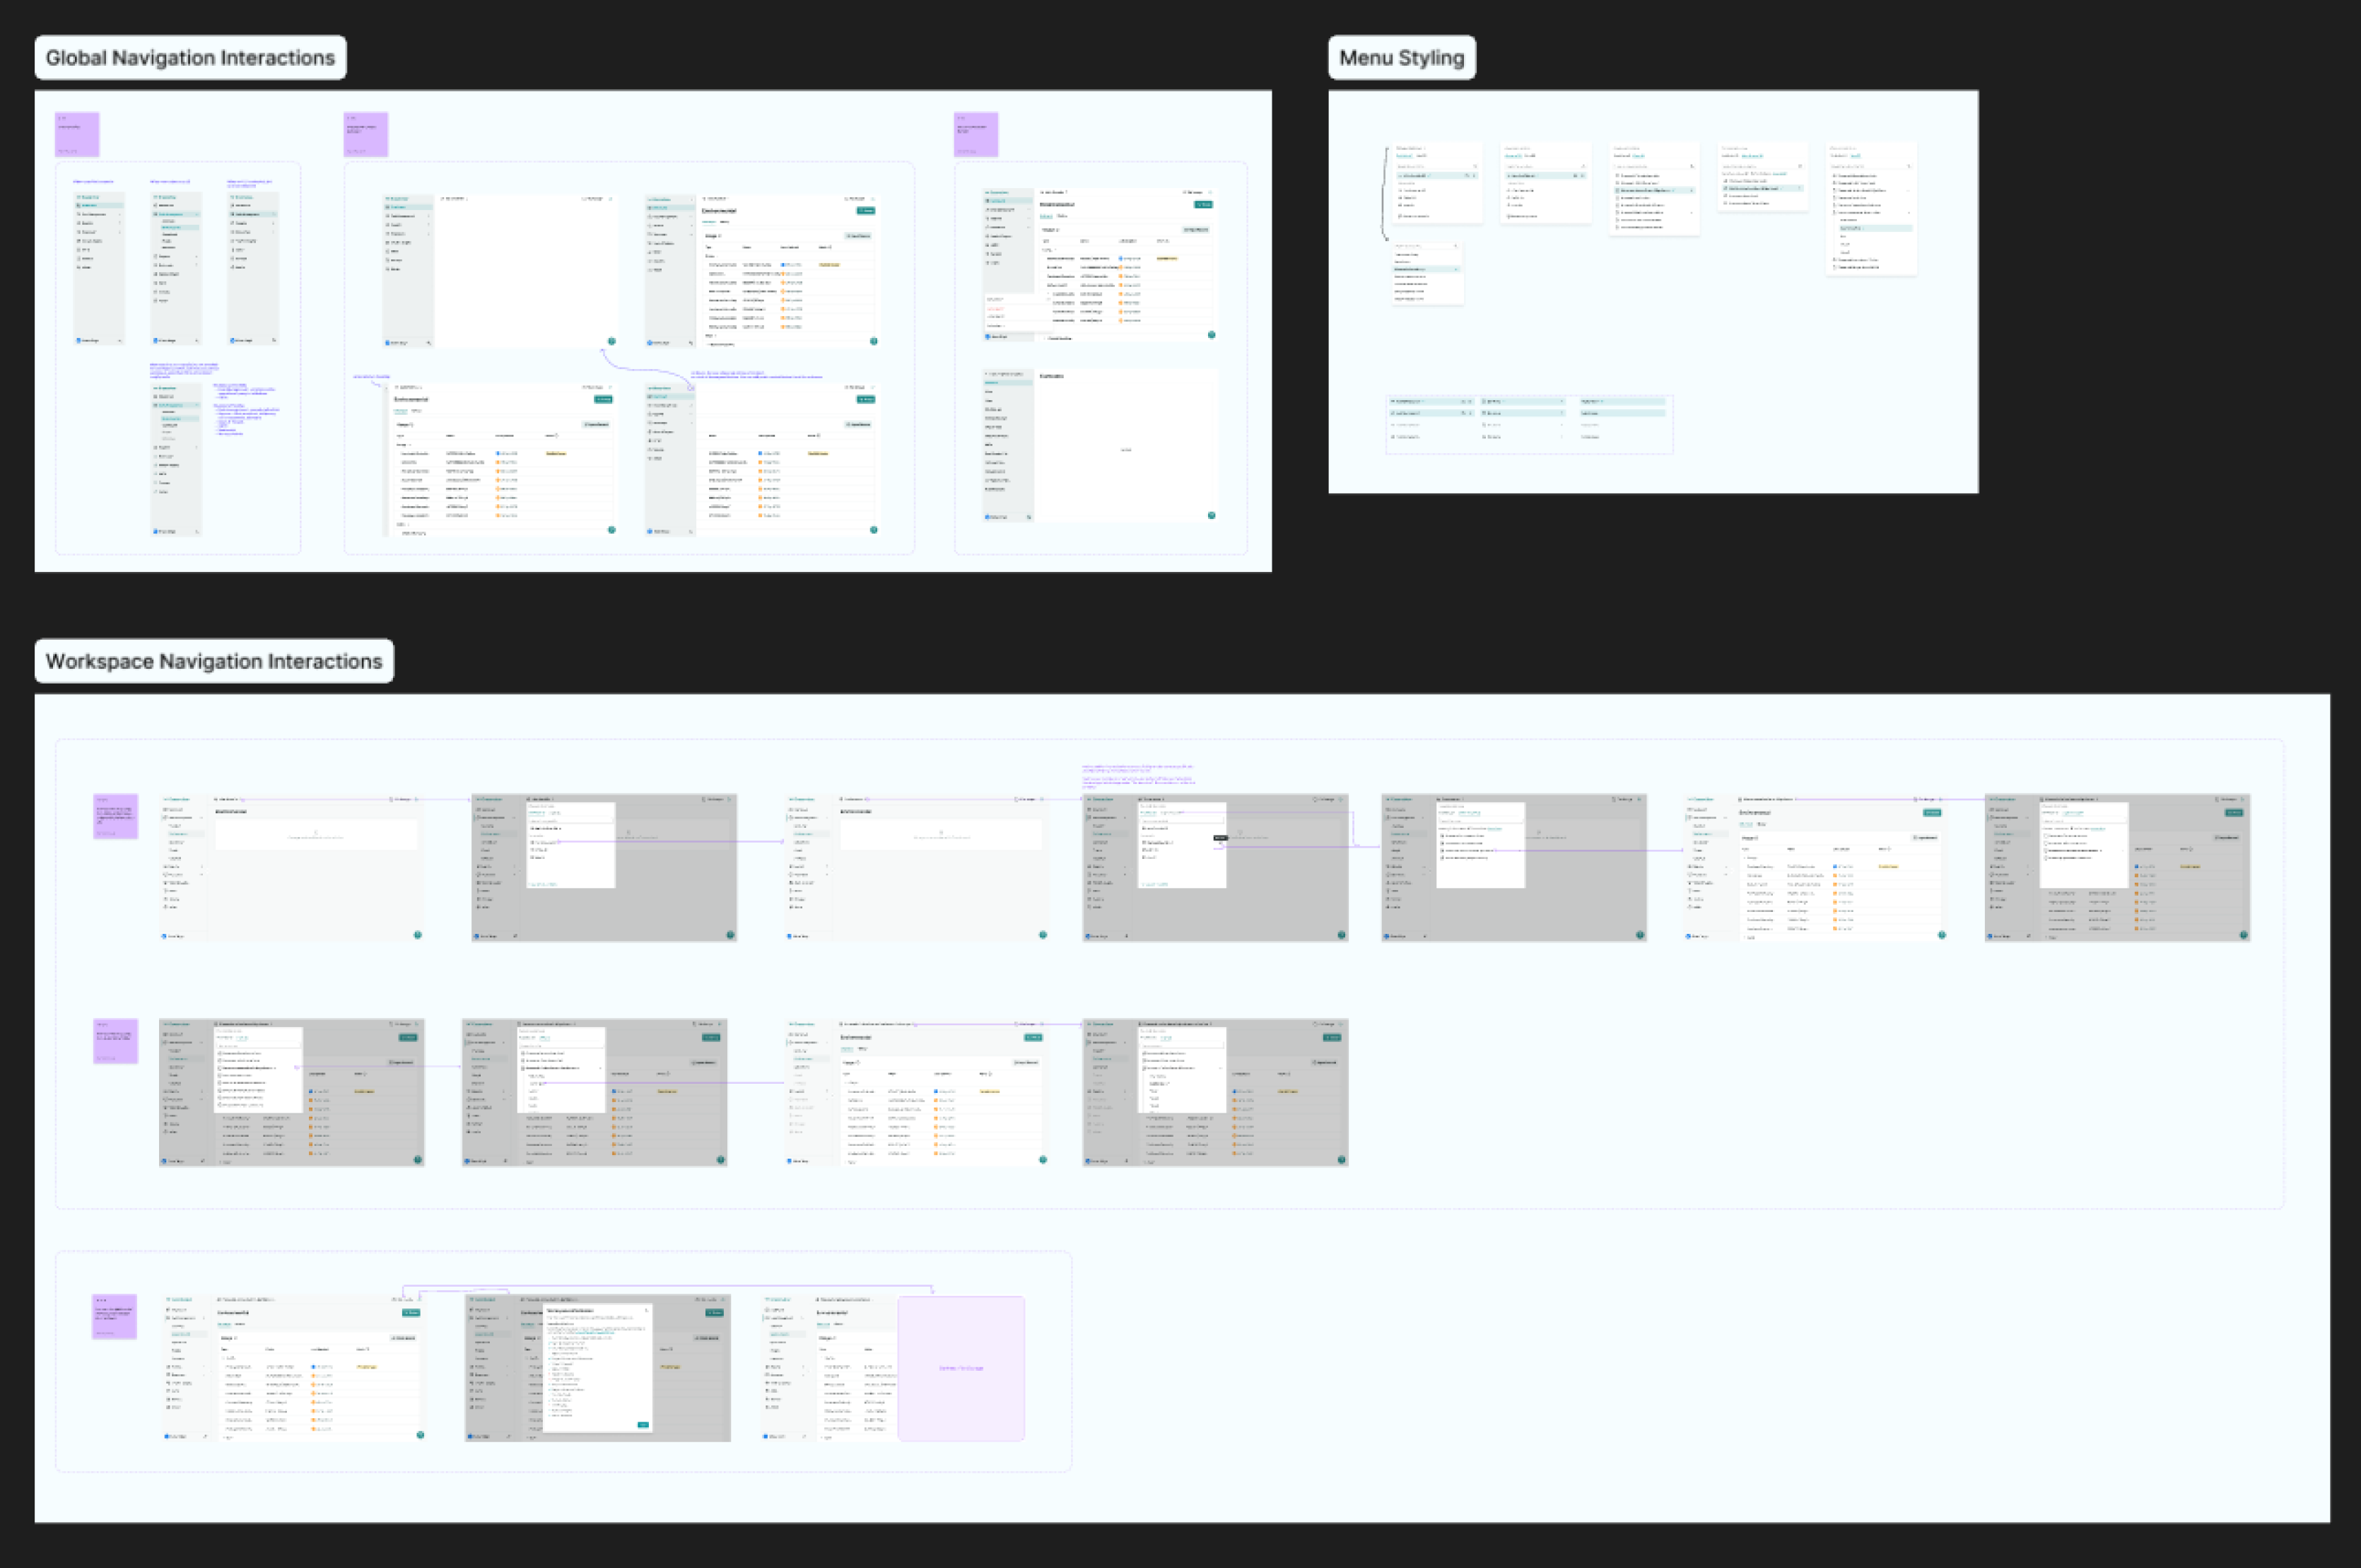
Each feature goes through multiple design reviews. I like to bring software developers in early so they can weigh in on any development constraints. Once the scope narrows, I create detailed design specifications that capture our discussions and key design decisions.
Feature Highlights
Due to sensitive intellectual property, only certain features and screens can be shown. In total, we developed 12 modules over 9 months. Here are a few feature highlights.
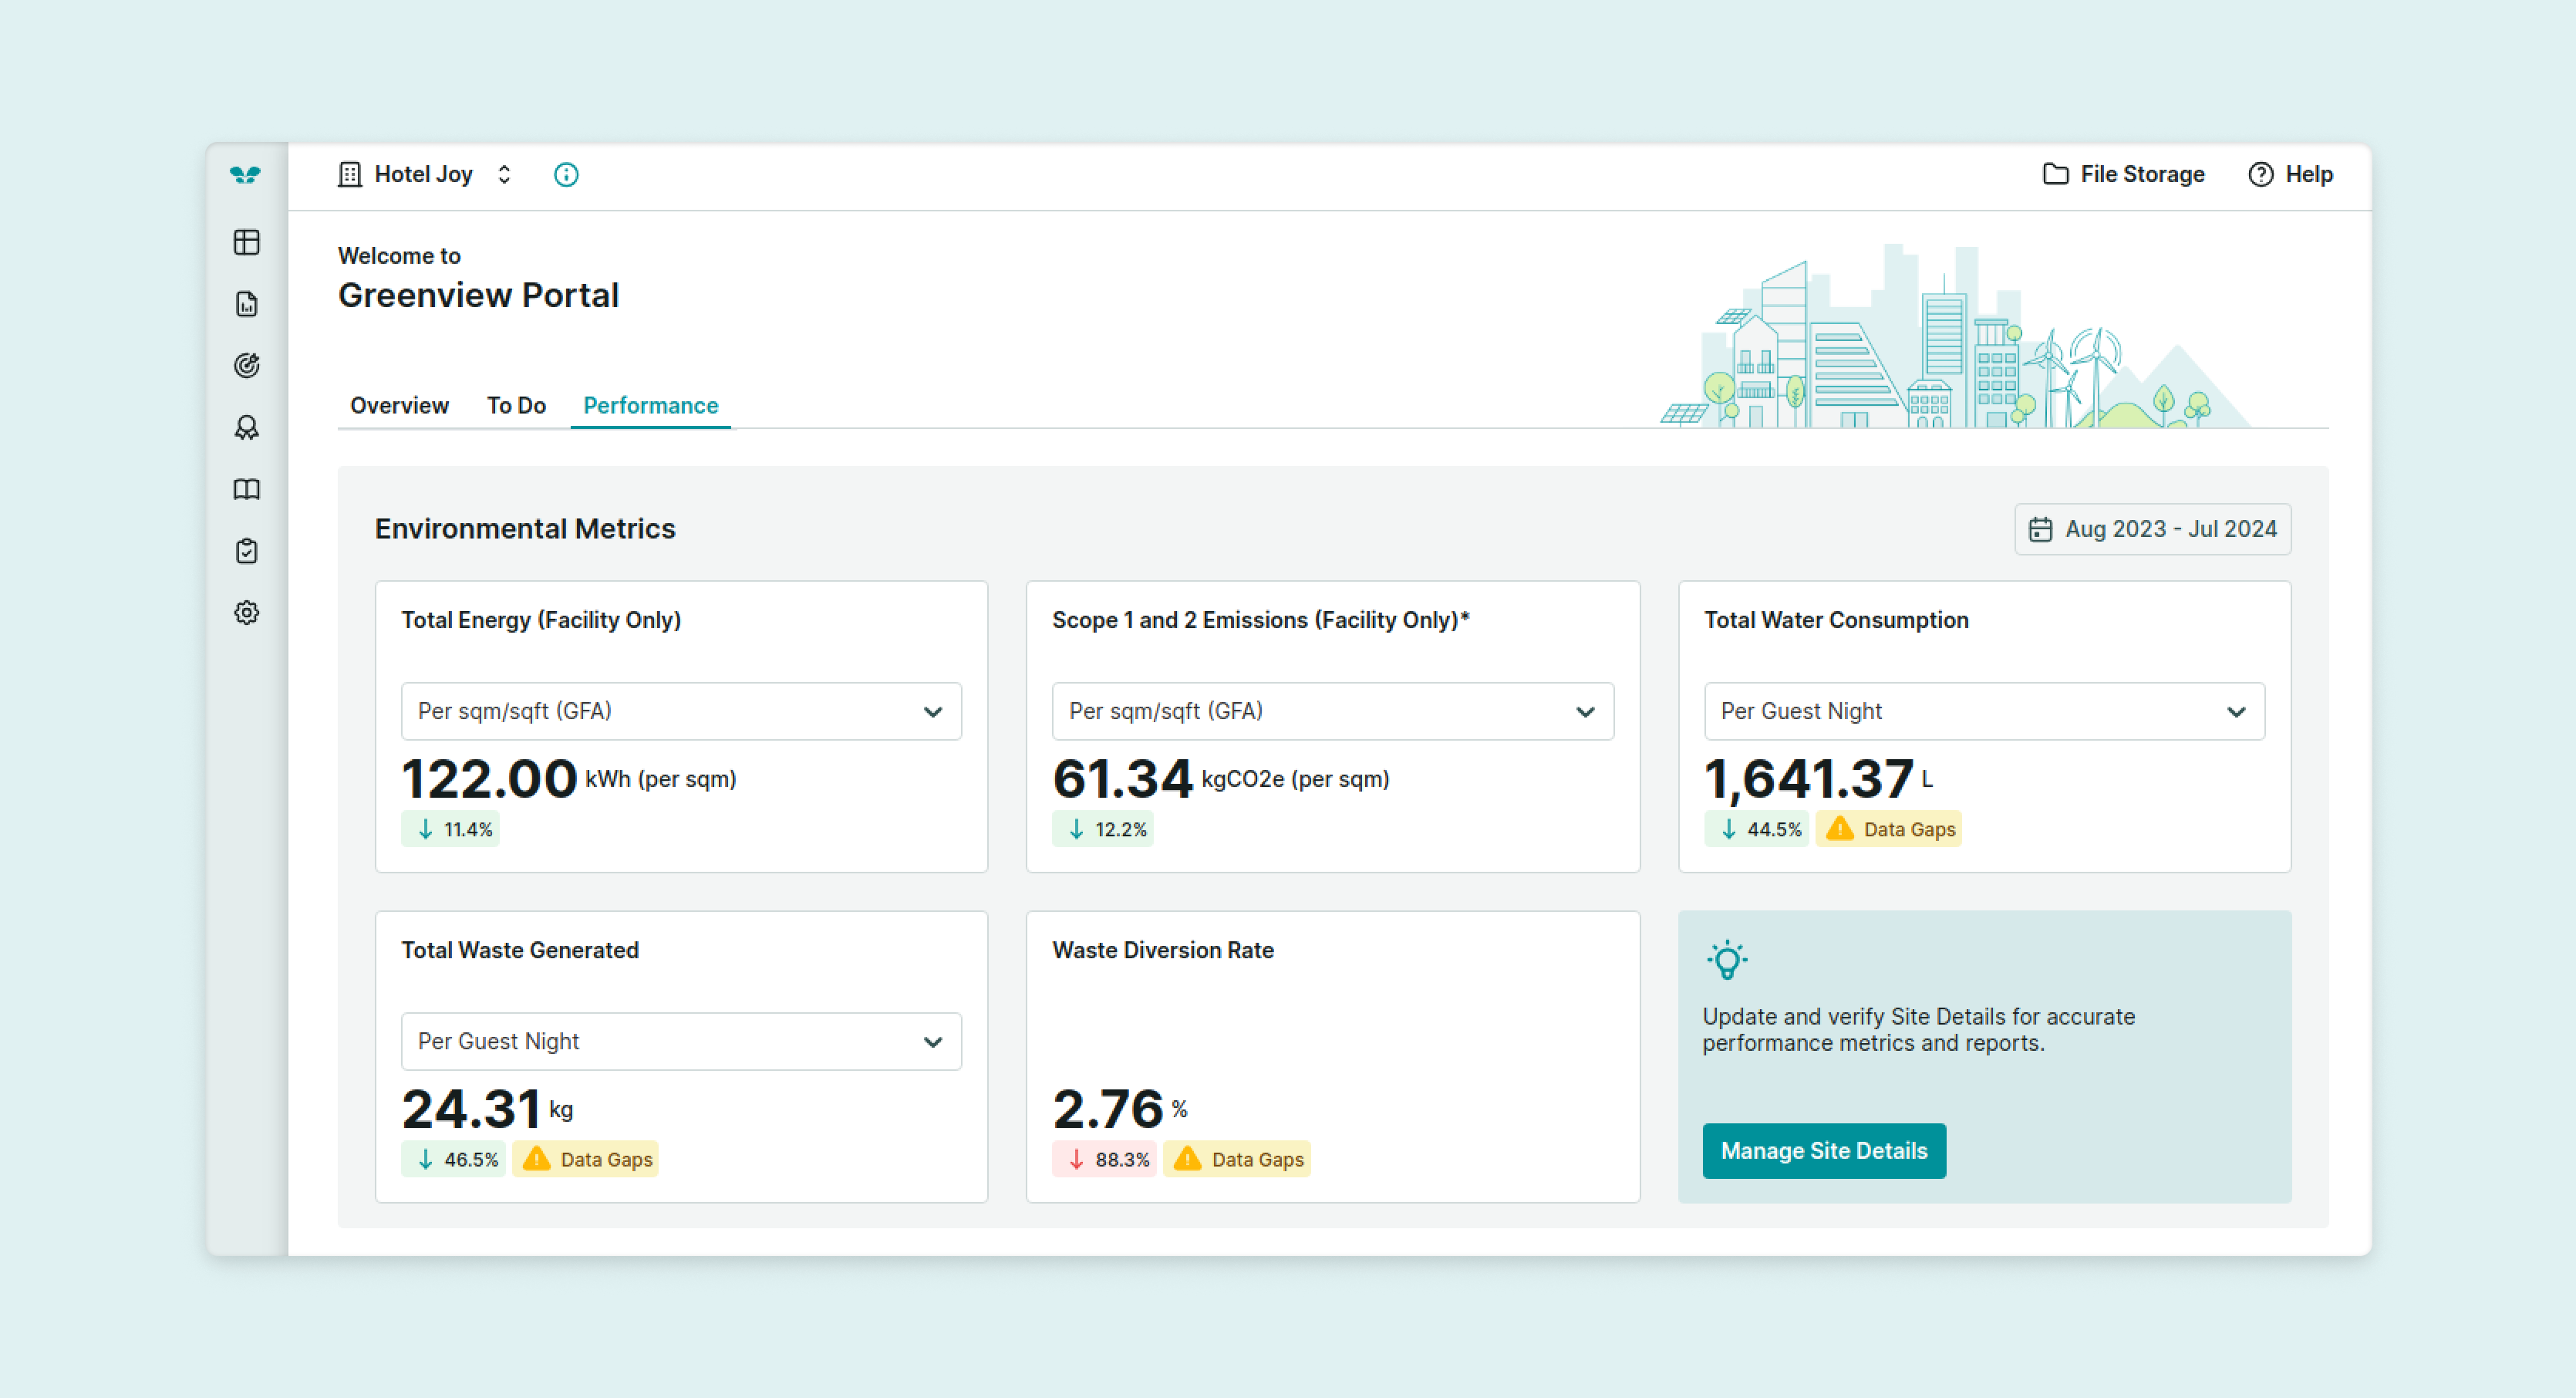
Our app features a dashboard homepage that helps users track live ESG data, crucial for sustainability meetings and keeping numbers on track. It provides a quick overview, allowing users to monitor progress without digging into detailed reports.

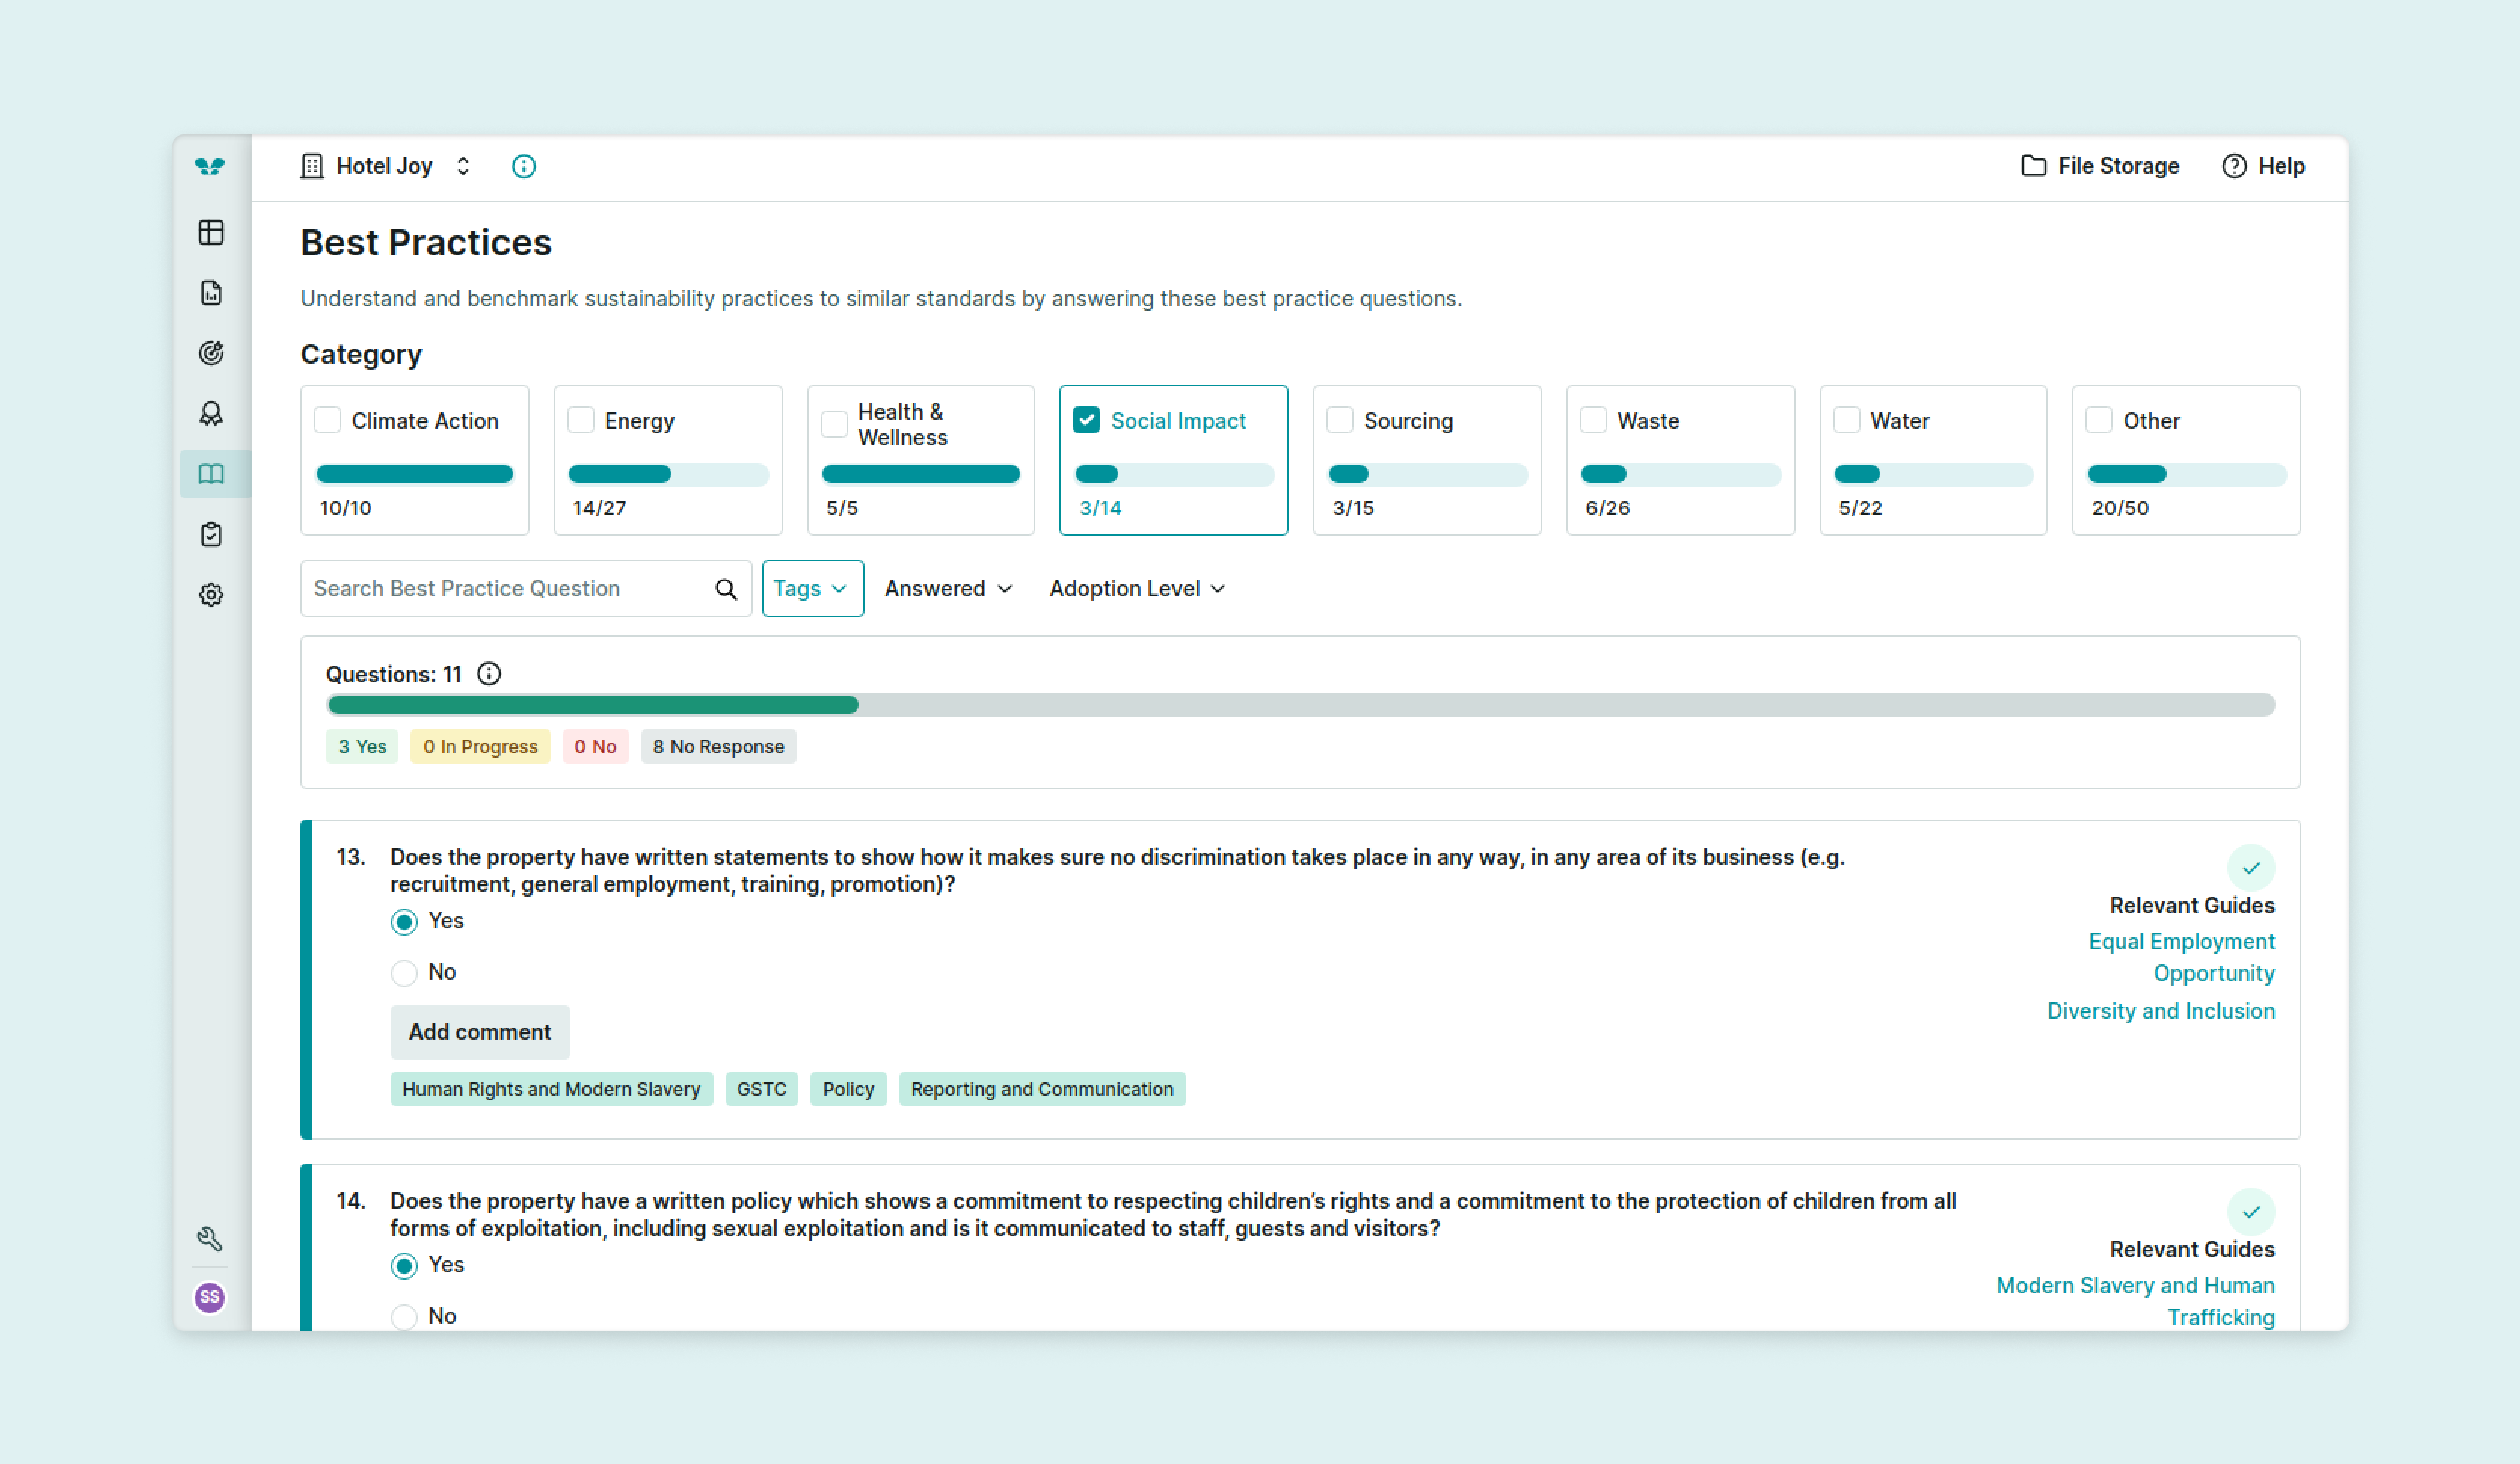
This feature lets users benchmark their sustainability practices against industry standards, drawing from Greenview’s expertise. It serves as a self-assessment tool for hotels, allowing them to evaluate their alignment with typical industry practices.
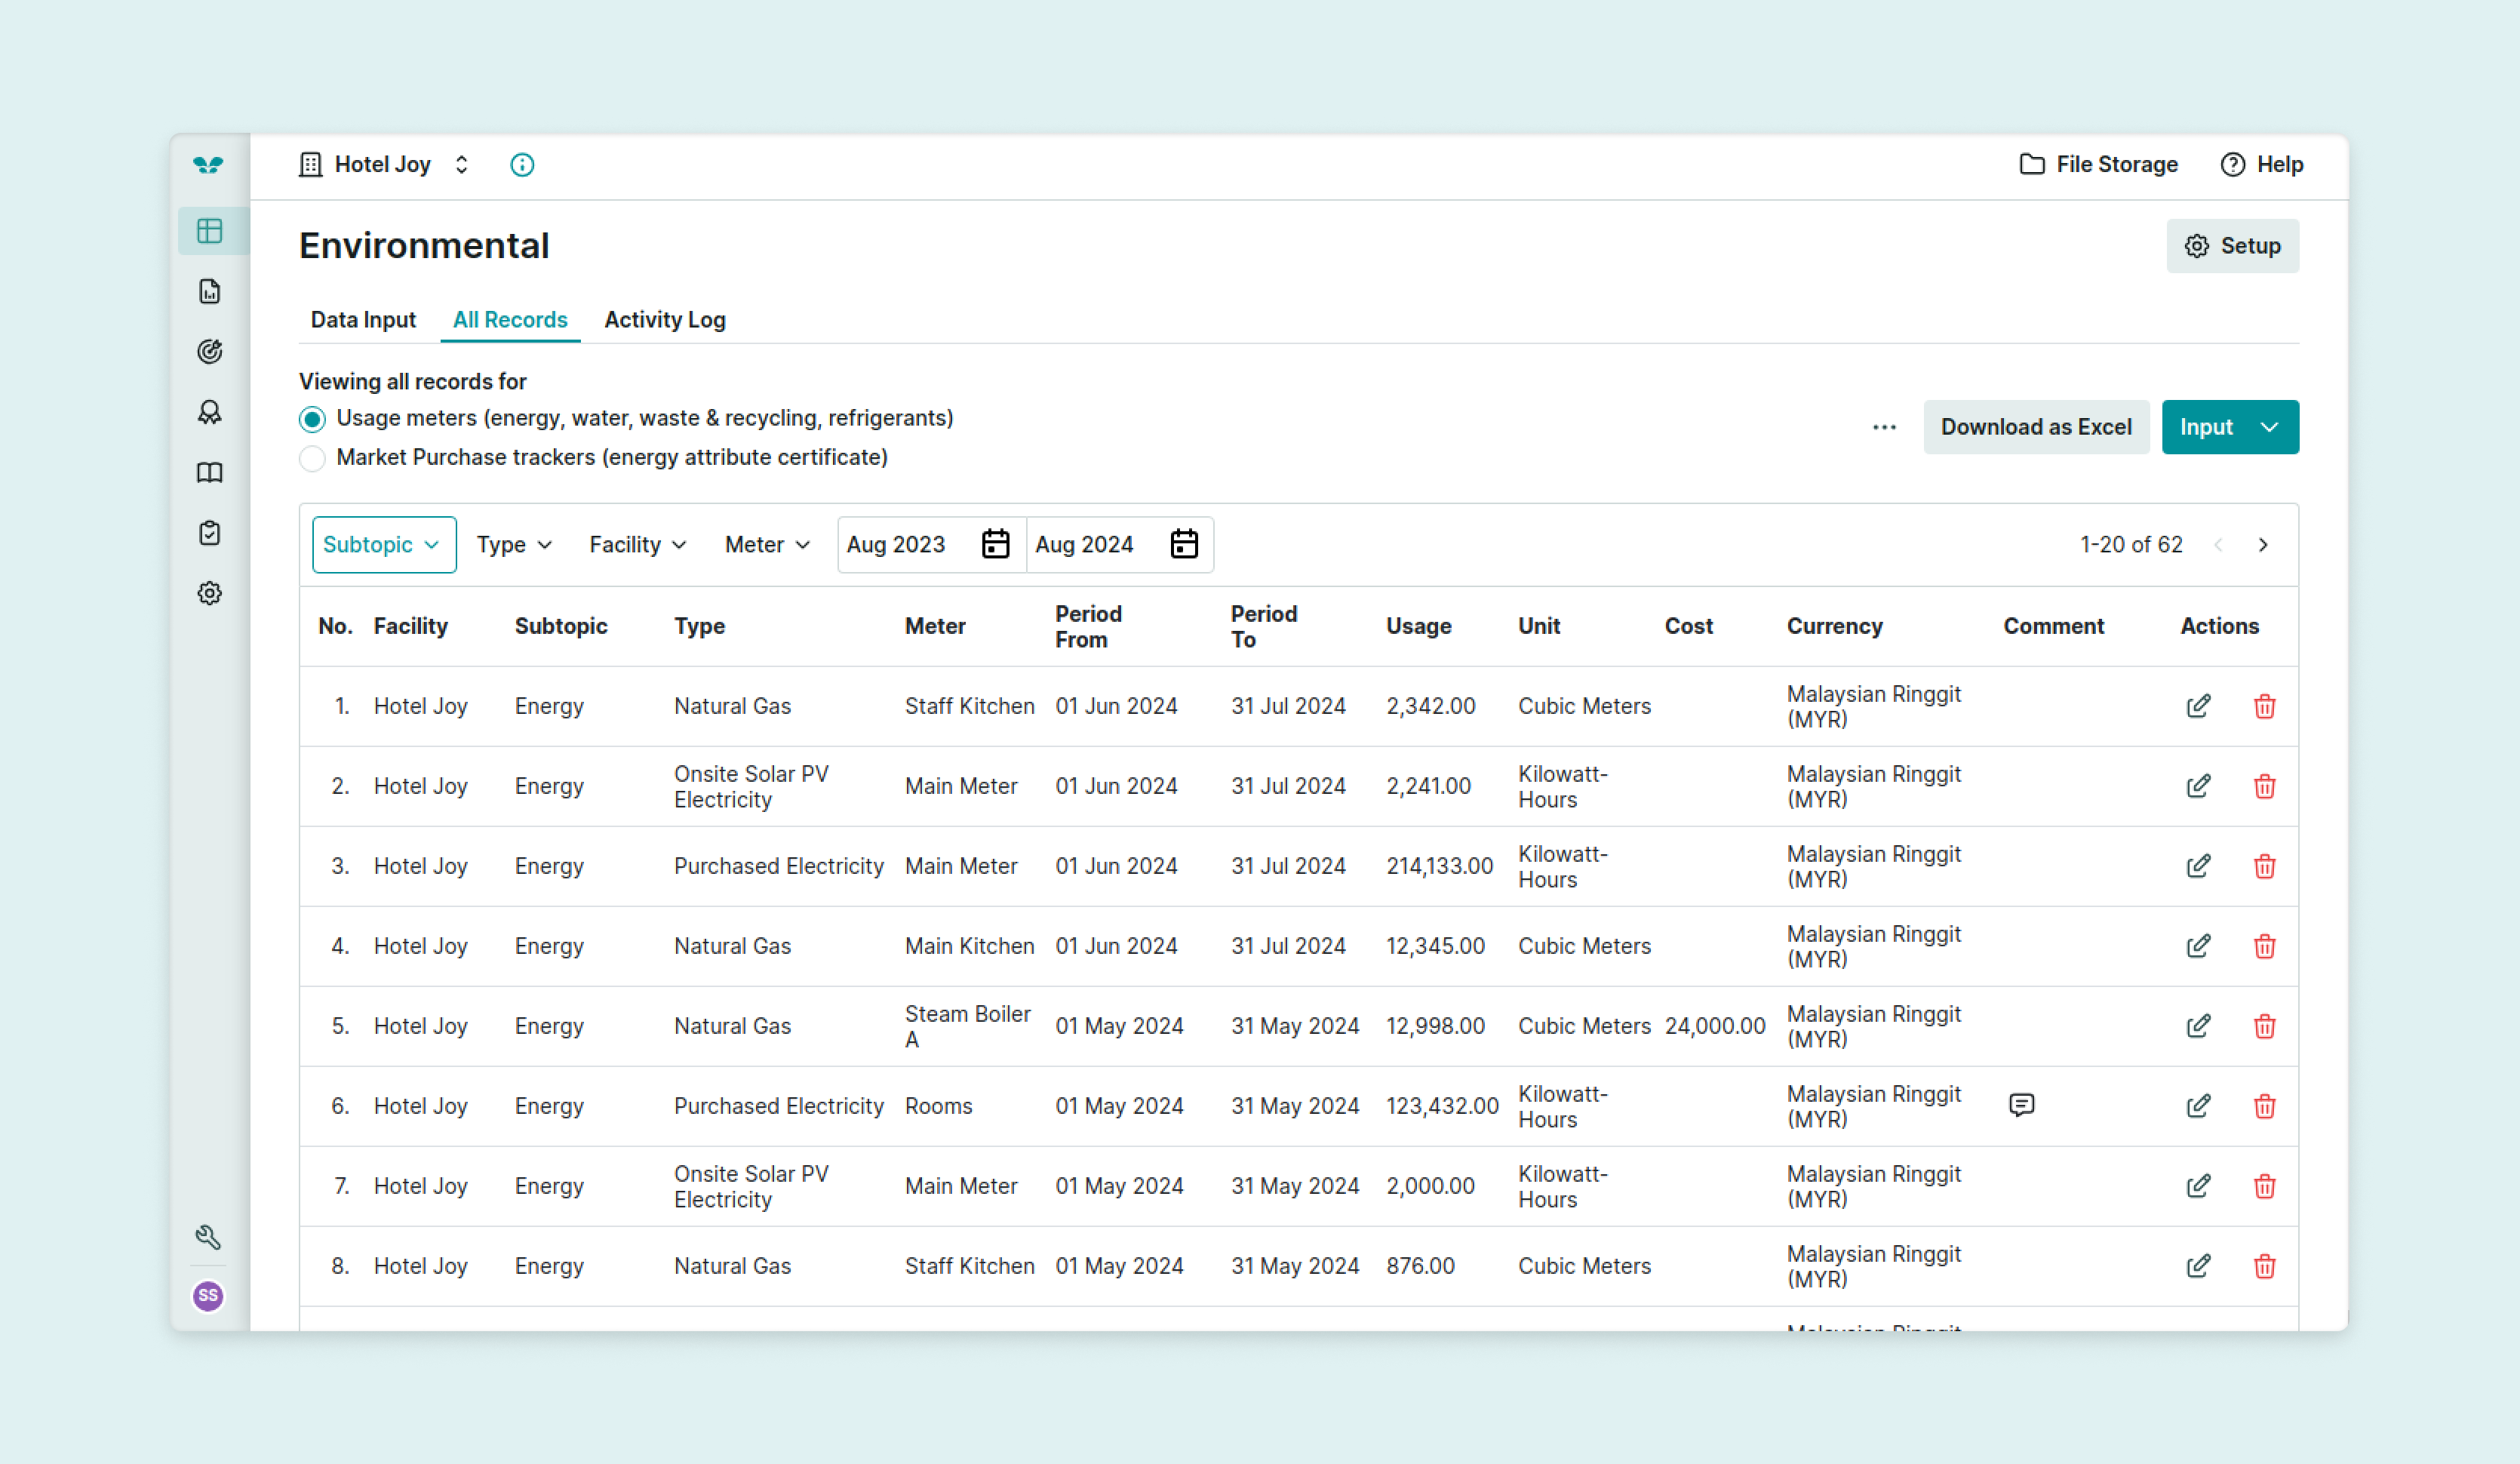
This section collects environmental data, which powers other parts of the portal, especially for generating reports. The data input process includes collaboration to ensure accuracy, and by this stage, the data has already been cleaned and normalised for use.
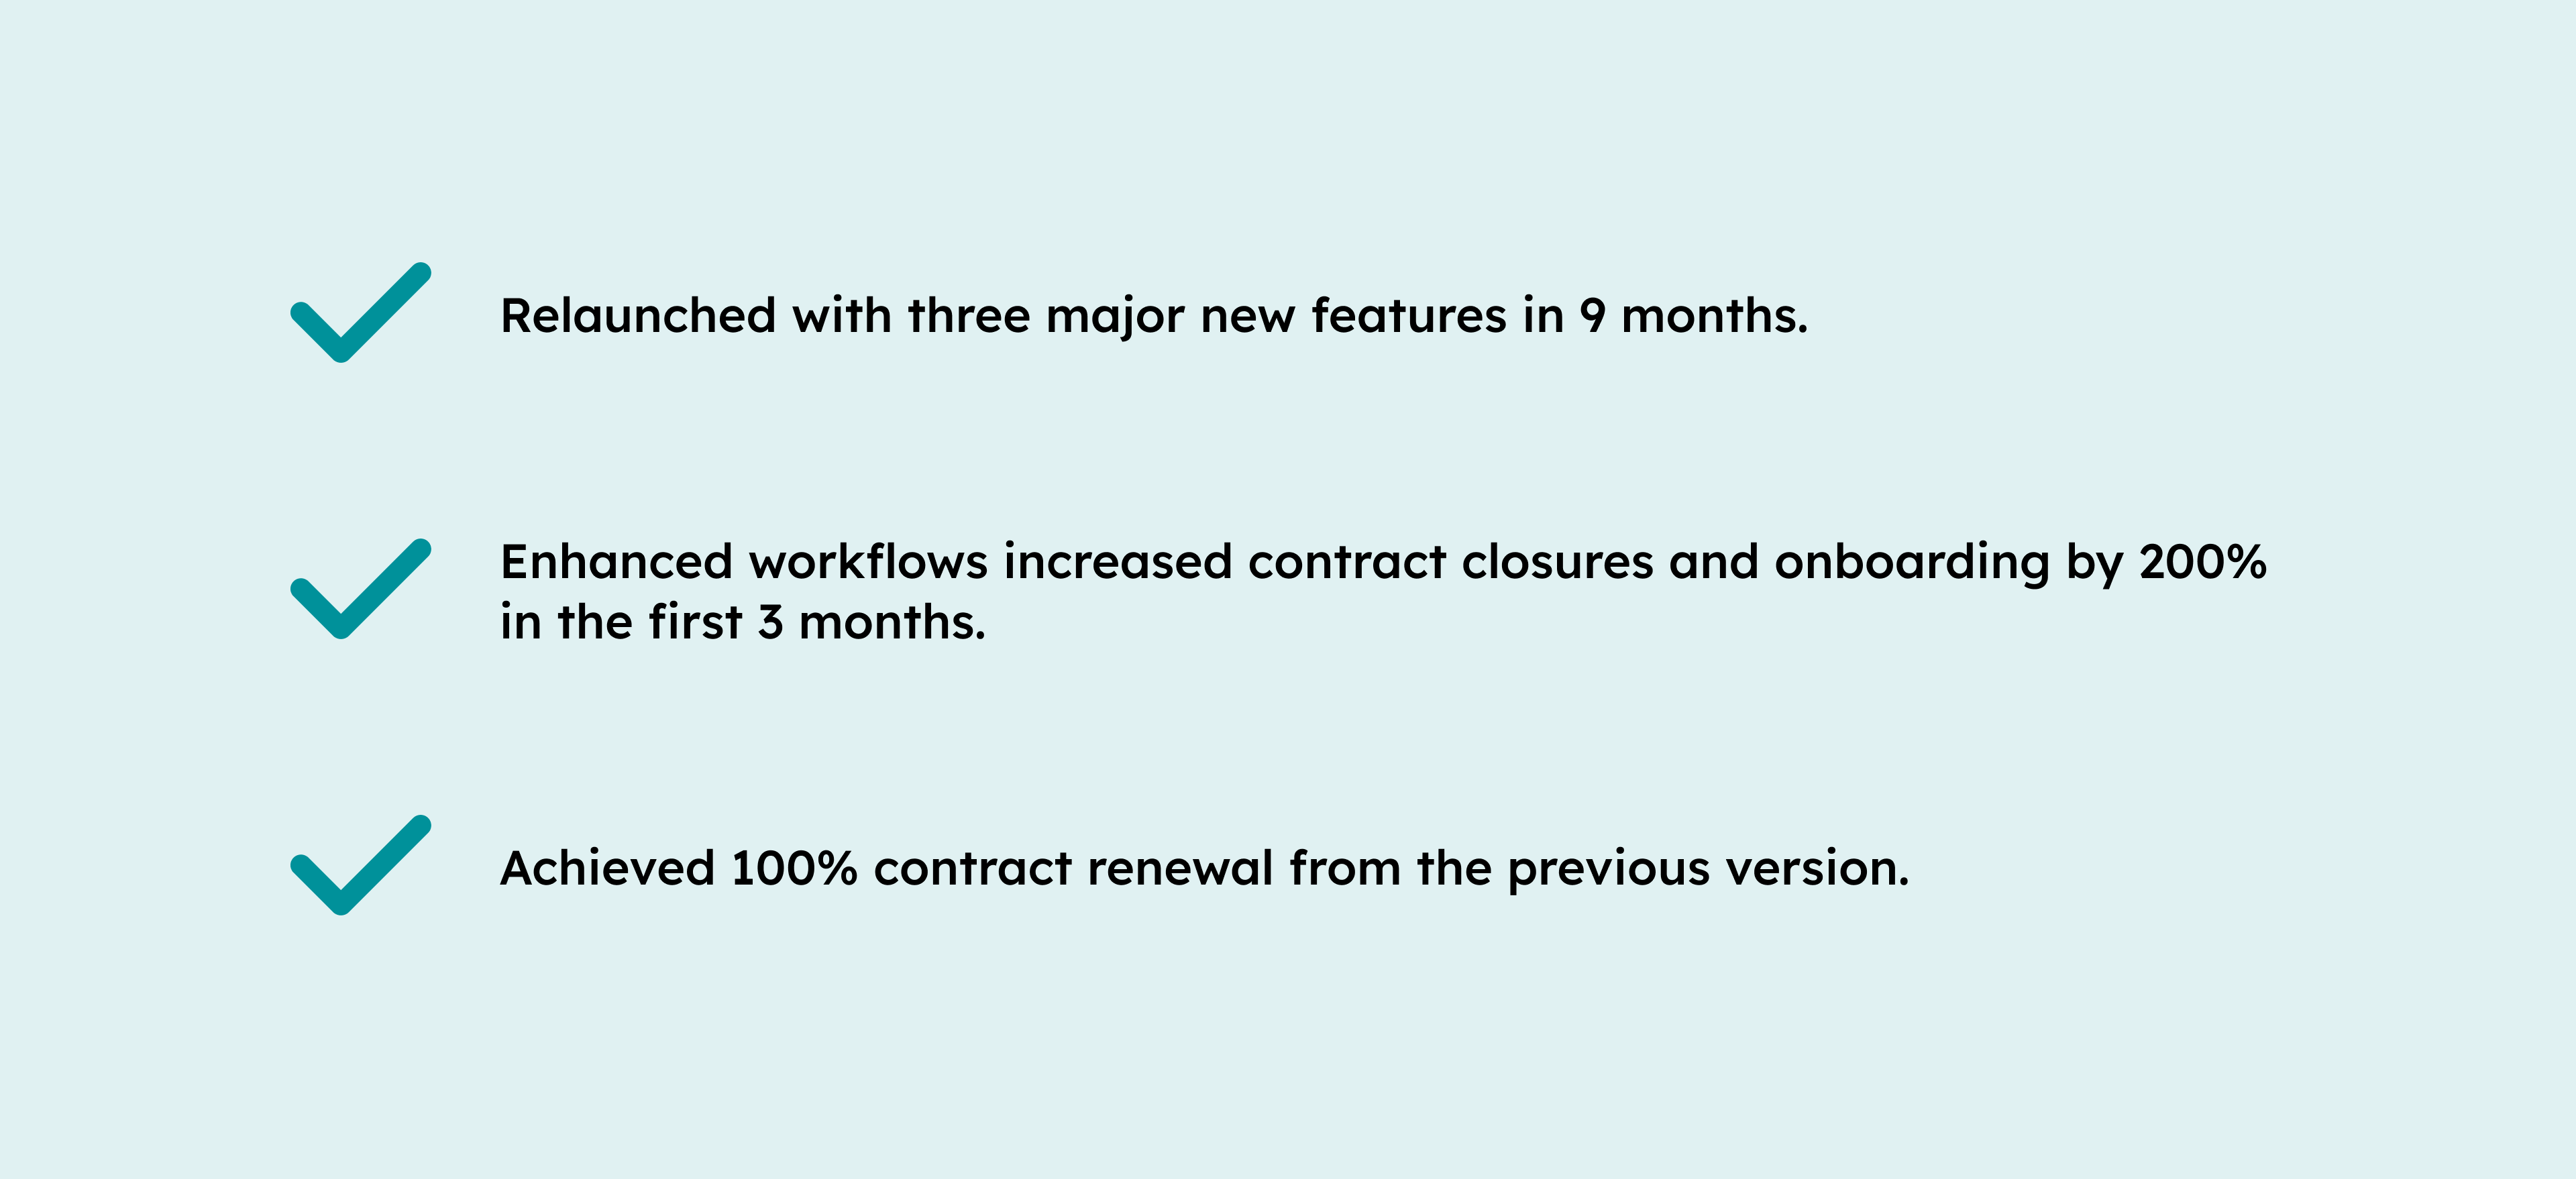
Impact
Our upgrades to the infrastructure and user flows provide a strong foundation, with the full impact of these improvements continuing to unfold over time.